Open Source 101 at Home 2020 – Event Summary
May 19, 2020 When trying something new we never, ever assume success. In the context of events there are just too many variables “in play” we can’t and don’t control.
That said we were thankful and thrilled when last week’s Open Source 101 at Home event was a pretty big hit.
Open Source 101 at Home Summary
Nearly 1,000 from all over the world joined us last Tuesday for our first 100% virtual conference, which was the largest number ever for a 101. It was also the largest number of countries ever represented at one of our events. The international presence in sessions, on chat boards, and in networking sessions was strong and really added a lot to the overall experience.
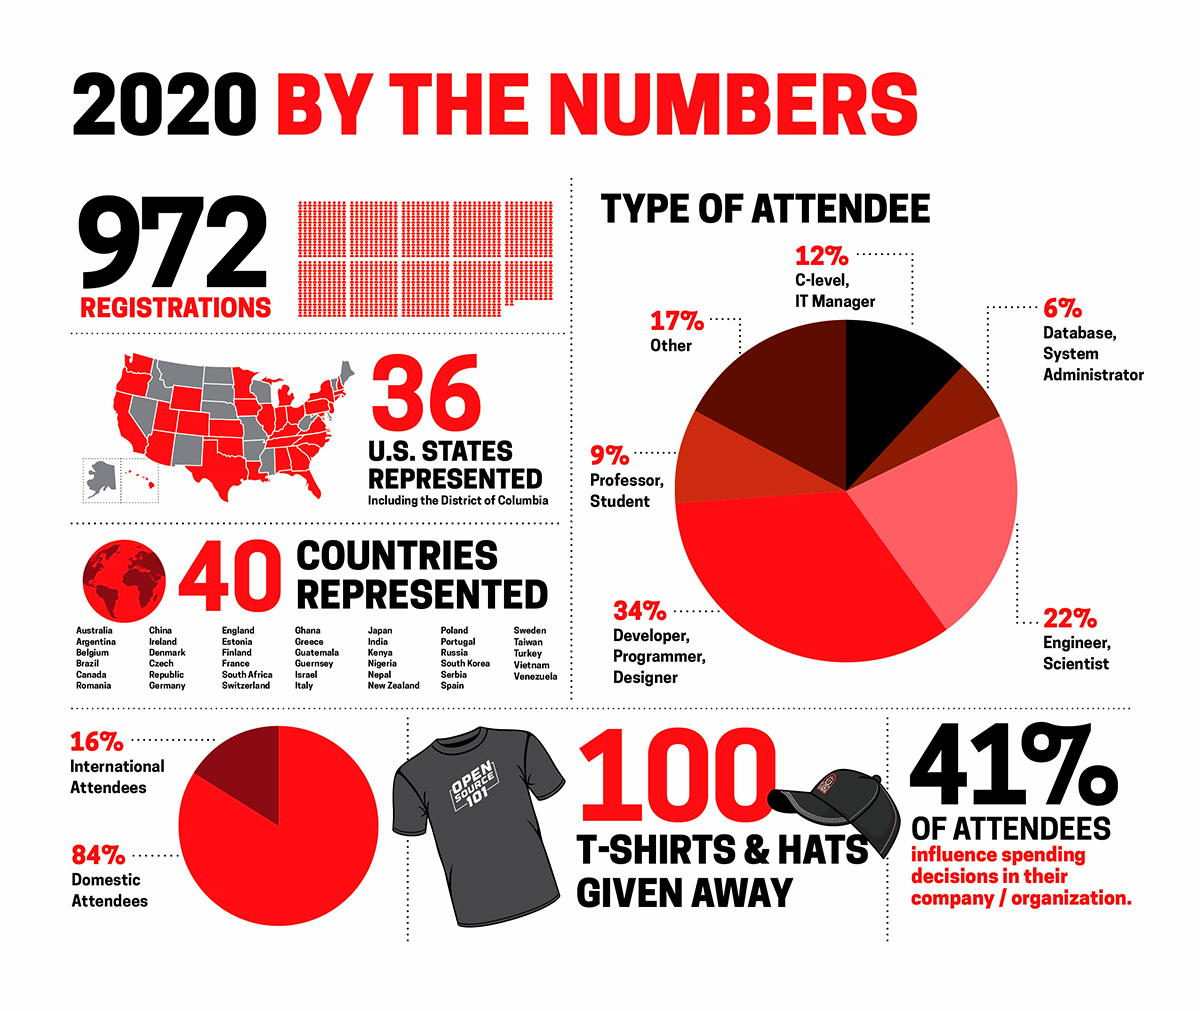 Total Registrations – 972
- Alabama
- North Carolina
- Arizona
- Texas
- Maryland
- California
- Illinois
- Colorado
- Connecticut
- Washington, DC
- Florida
- Georgia
- Hawaii
- Indiana
- Iowa
- Kentucky
- Kansas
- Louisiana
- Massachusetts
- Michigan
- Minnesota
- Missouri
- New Jersey
- New Hampshire
- New York
- Oklahoma
- Oregon
- Ohio
- Pennsylvania
- Rhode Island
- South Carolina
- Tennessee
- Utah
- Virginia
- Washington
- Wyoming
# of countries represented – 40
- Australia
- Argentina
- Belgium
- Brazil
- Canada
- Romania
- China
- Ireland
- Denmark
- Czech Republic
- Germany
- England
- Estonia
- Finland
- France
- South Africa
- Switzerland
- Ghana
- Greece
- Guatemala
- Guernsey
- Israel
- Italy
- Japan
- India
- Kenya
- Nigeria
- Nepal
- New Zealand
- Poland
- Portugal
- Russia
- South Korea
- Serbia
- Spain
- Sweden
- Taiwan
- Turkey
- Vietnam
- Venezuela
% of International versus Domestic attendees
- US 84%
- International 16%
How attendees identified themselves
- C-level / IT manager 12%
- Data / Sys Admins 6%
- Engineer / Scientist 22%
- Developer / Programmer / Designer 34%
- Professor / Student 9%
- Other 17%
Do you influence spending decisions?
- Yes 41%
- No 59%
# of shirts & hats given away – 100